Monitoring dashboard
You can monitor the current shift work on the dashboard in the Monitoring tab.
Important
This section provides screenshots with examples of the interface in Russian.
An example of a dashboard:
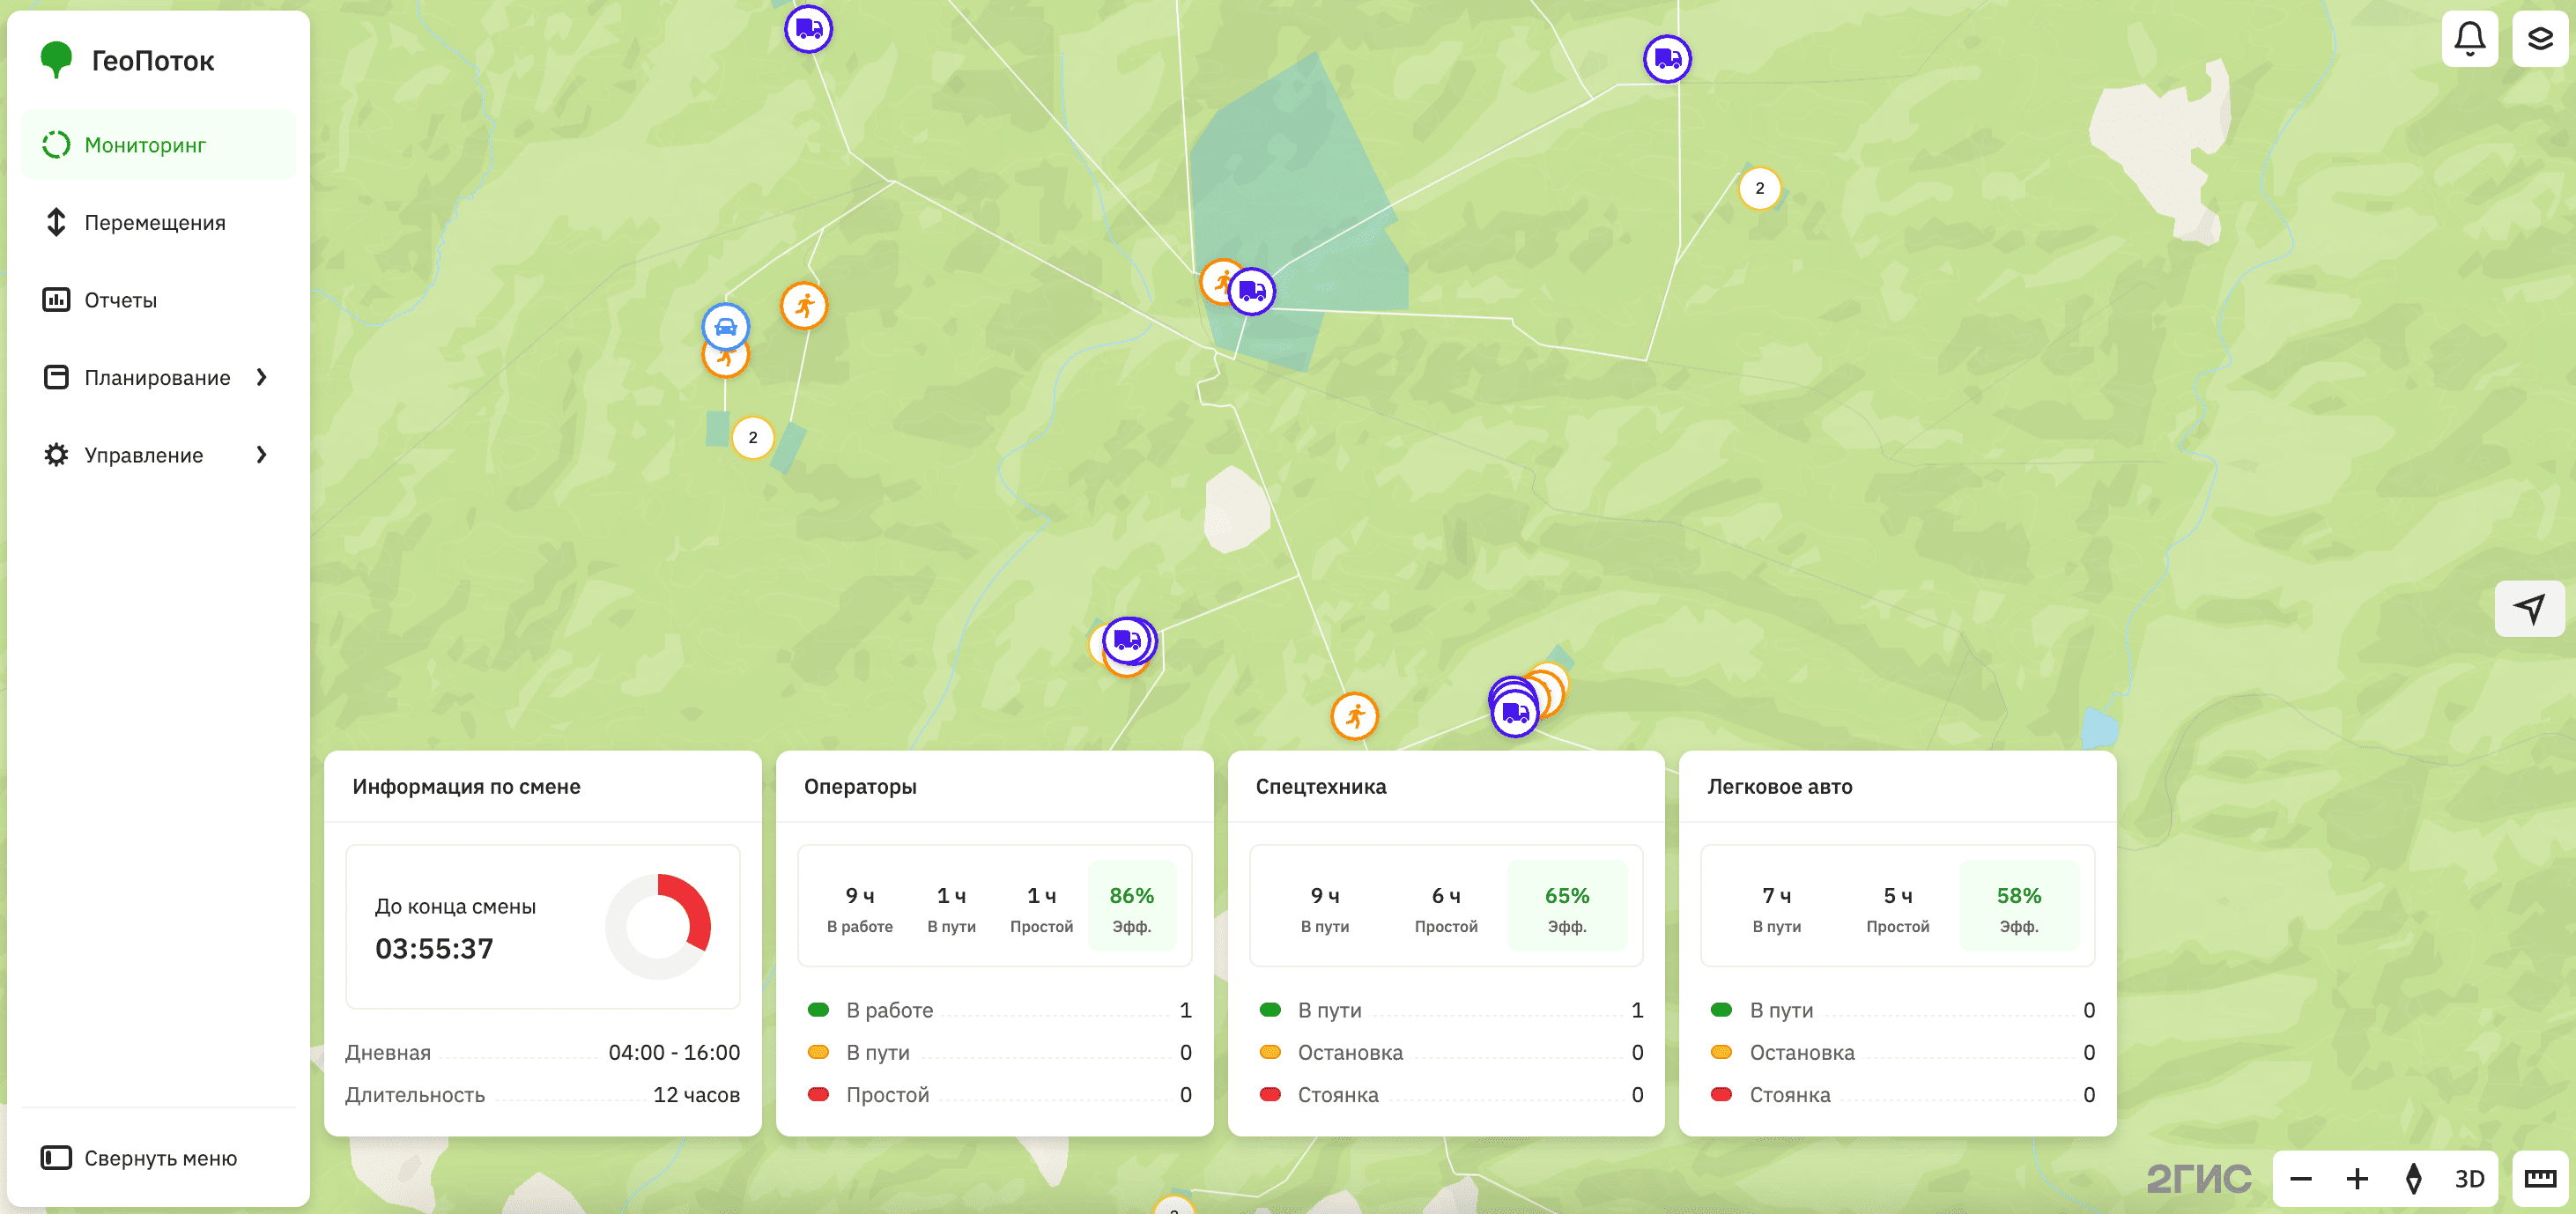
The monitoring dashboard allows you to:
-
Track objects (mobile employees, transport, etc.) in the shift in real time and view details.
-
Analyze shift statistics and work efficiency using widgets with key metrics.
-
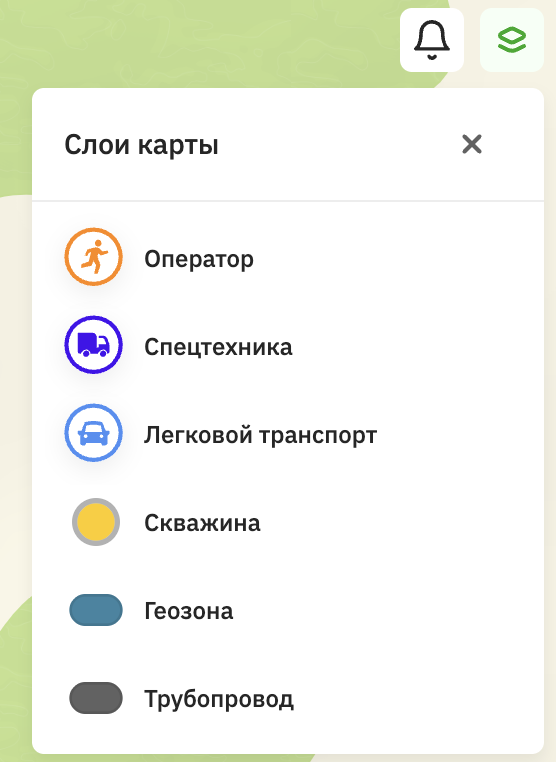
View geozones and organization infrastructure (e.g., roads, boreholes, etc.) on the map. The map includes a legend with layer symbols. Layers are configured during the 2GIS GeoFlow integration and depend on the specifics of your project.
An example of a legend:
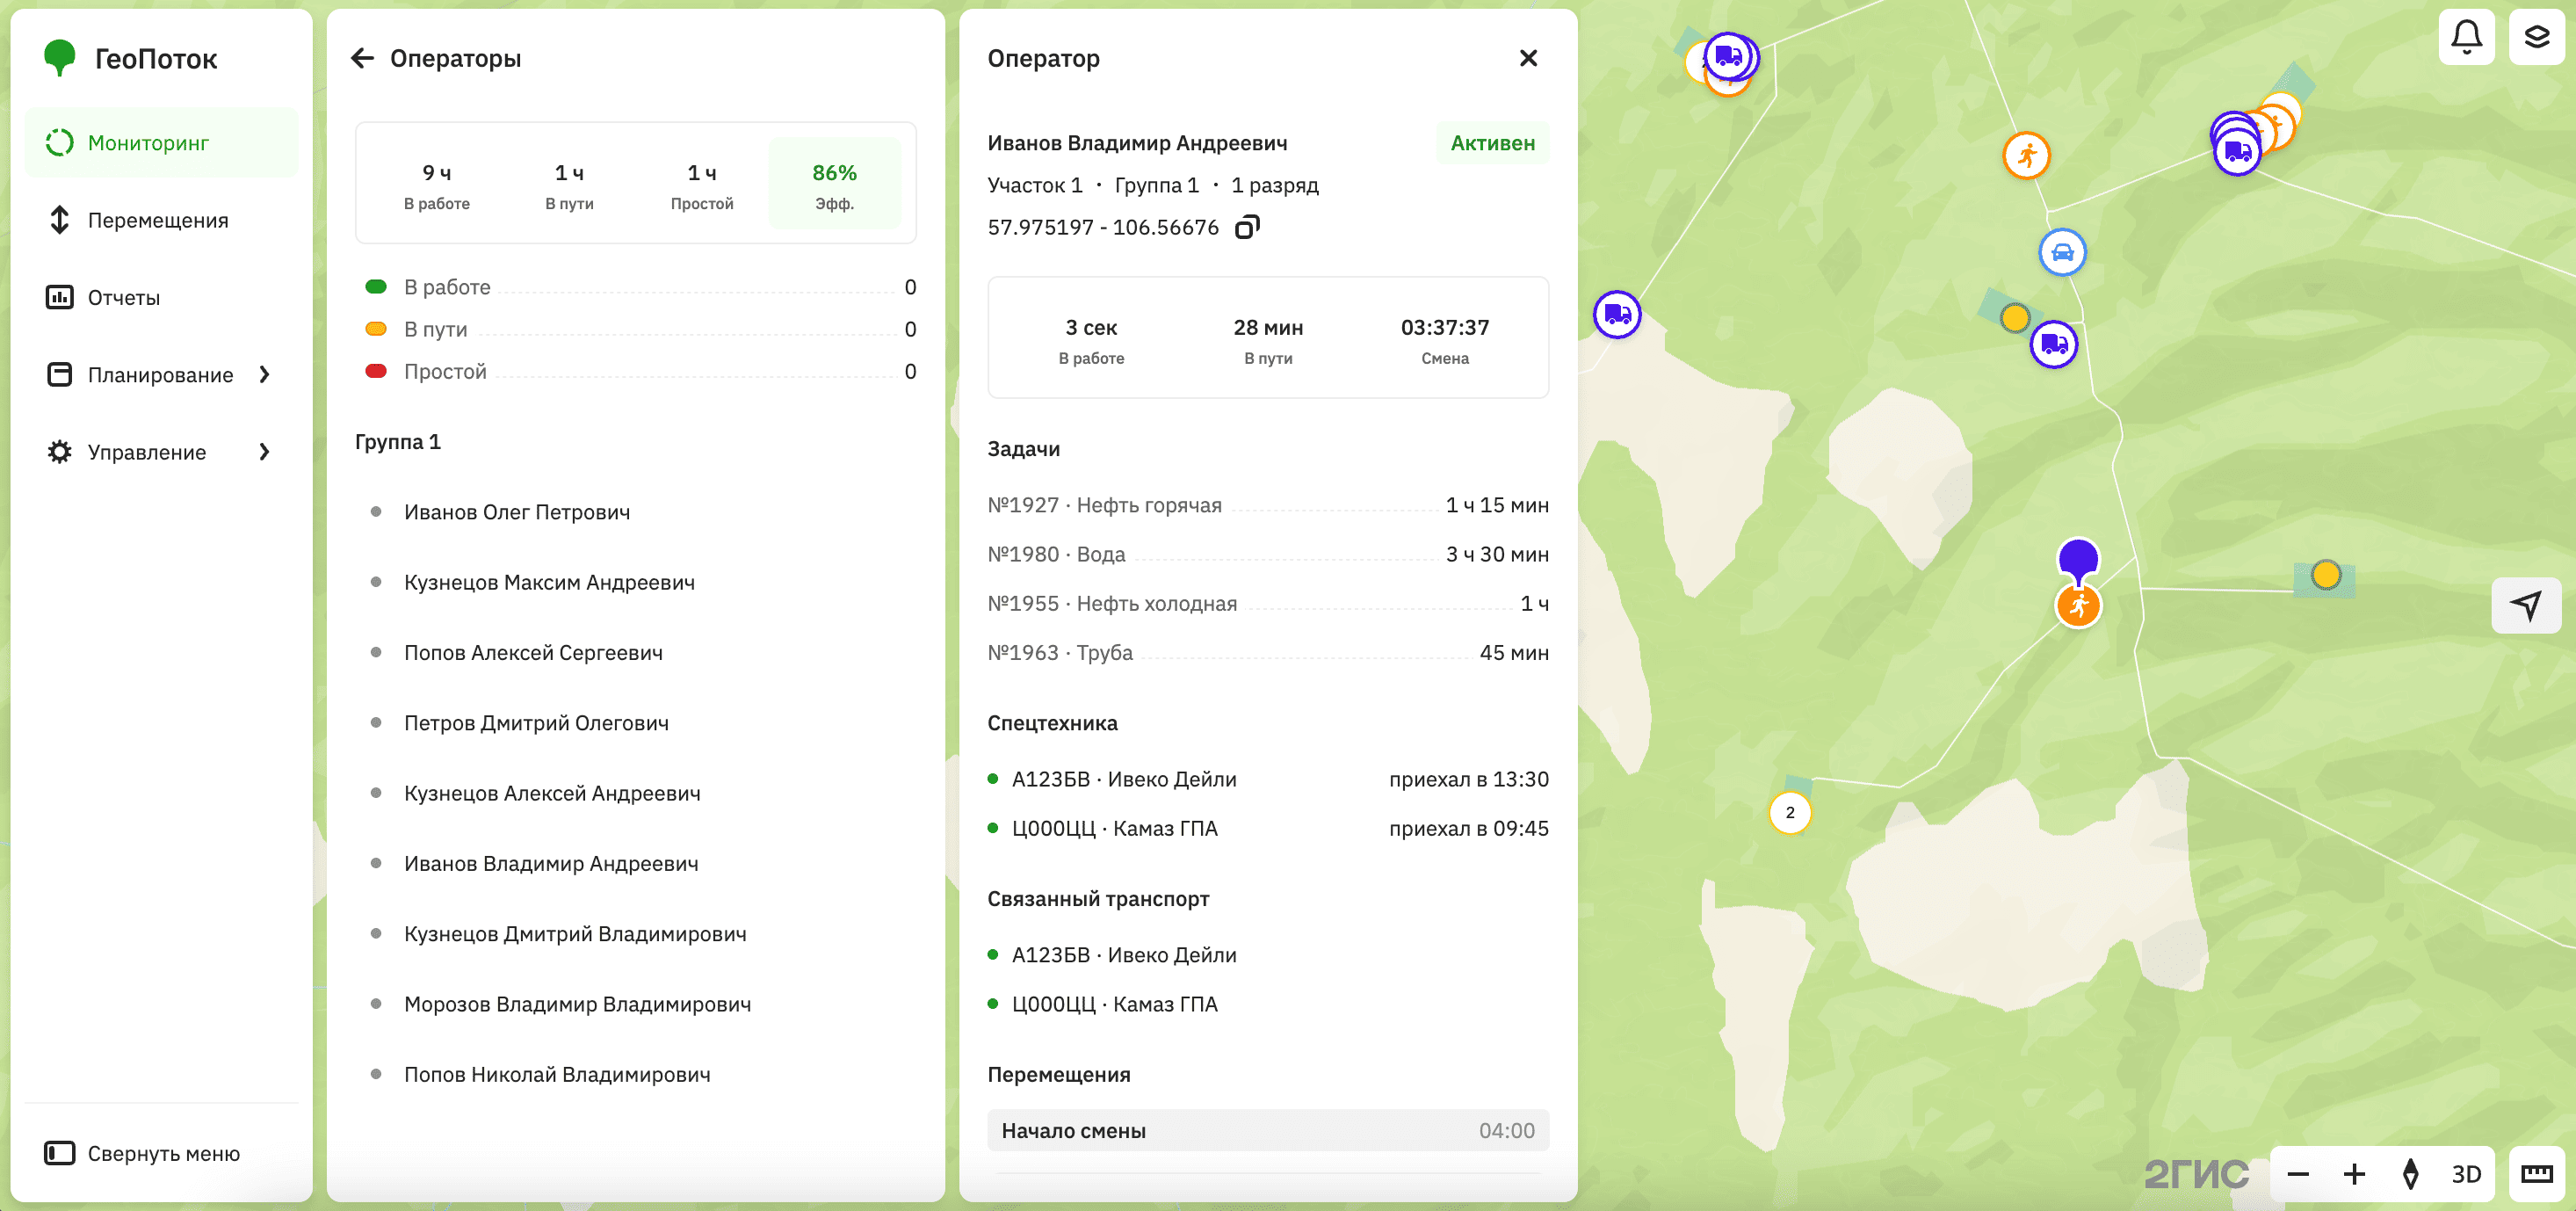
Tracking objects
Using the monitoring dashboard, you can view information about employees and transport in the shift in real time. The map displays:
- All objects added to the current shift.
- Objects not added to the shift if their movement within the organization territory is registered via a GPS sensor. If necessary, you can add these objects to the current shift to include their data in the shift statistics and movement history.
The set of objects may vary in your project.
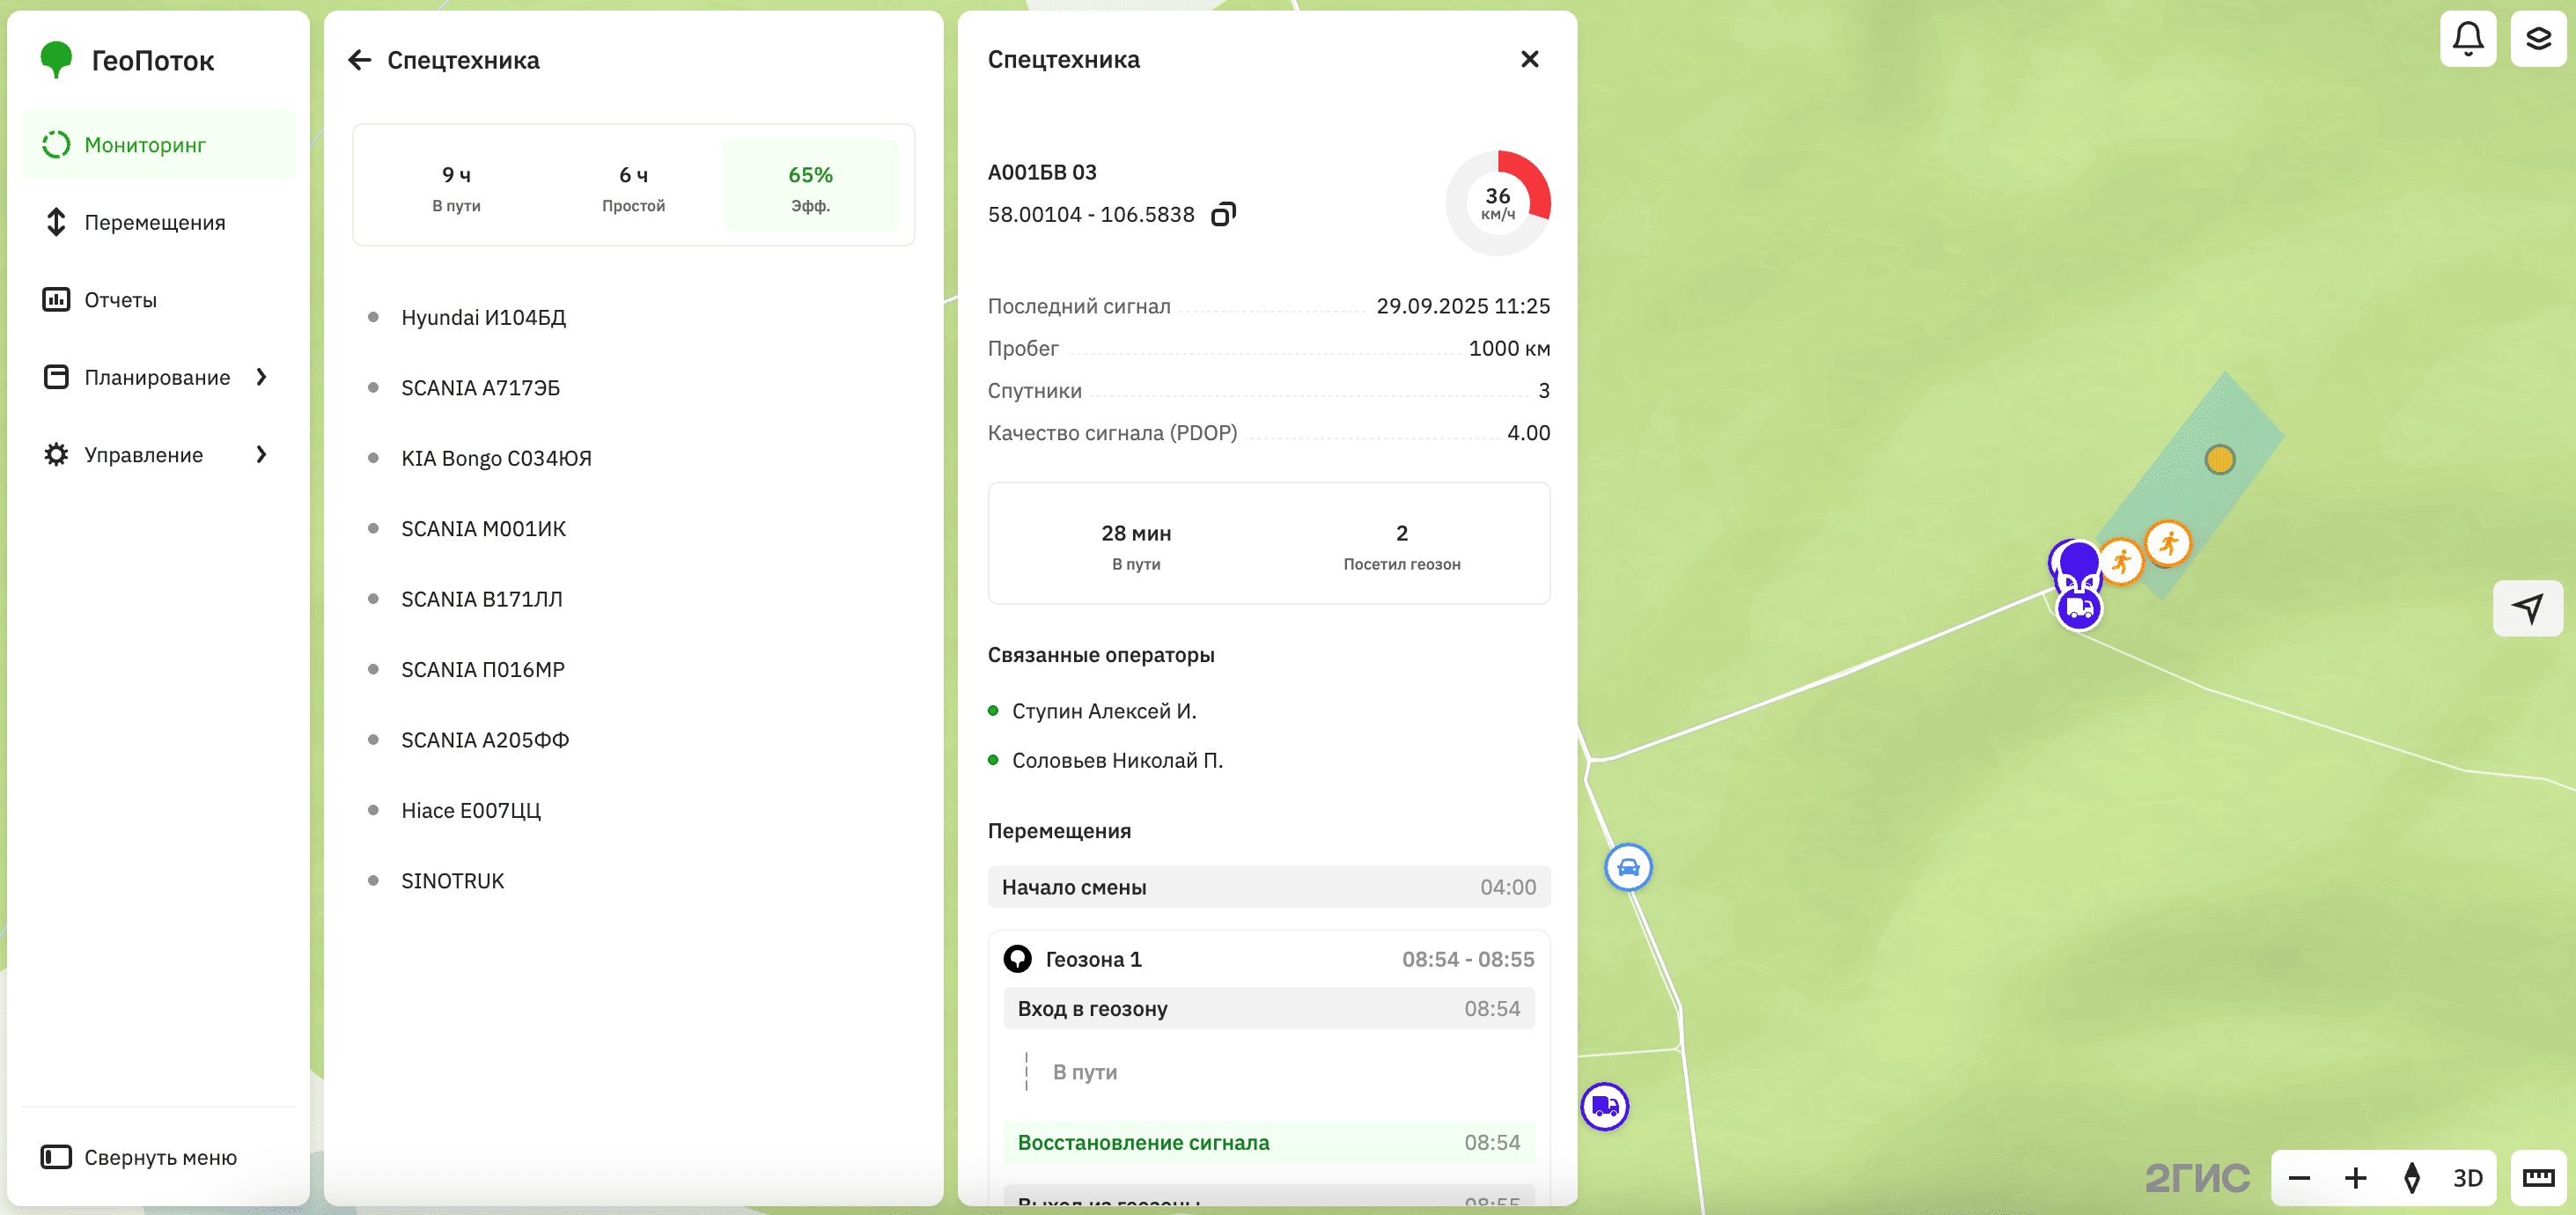
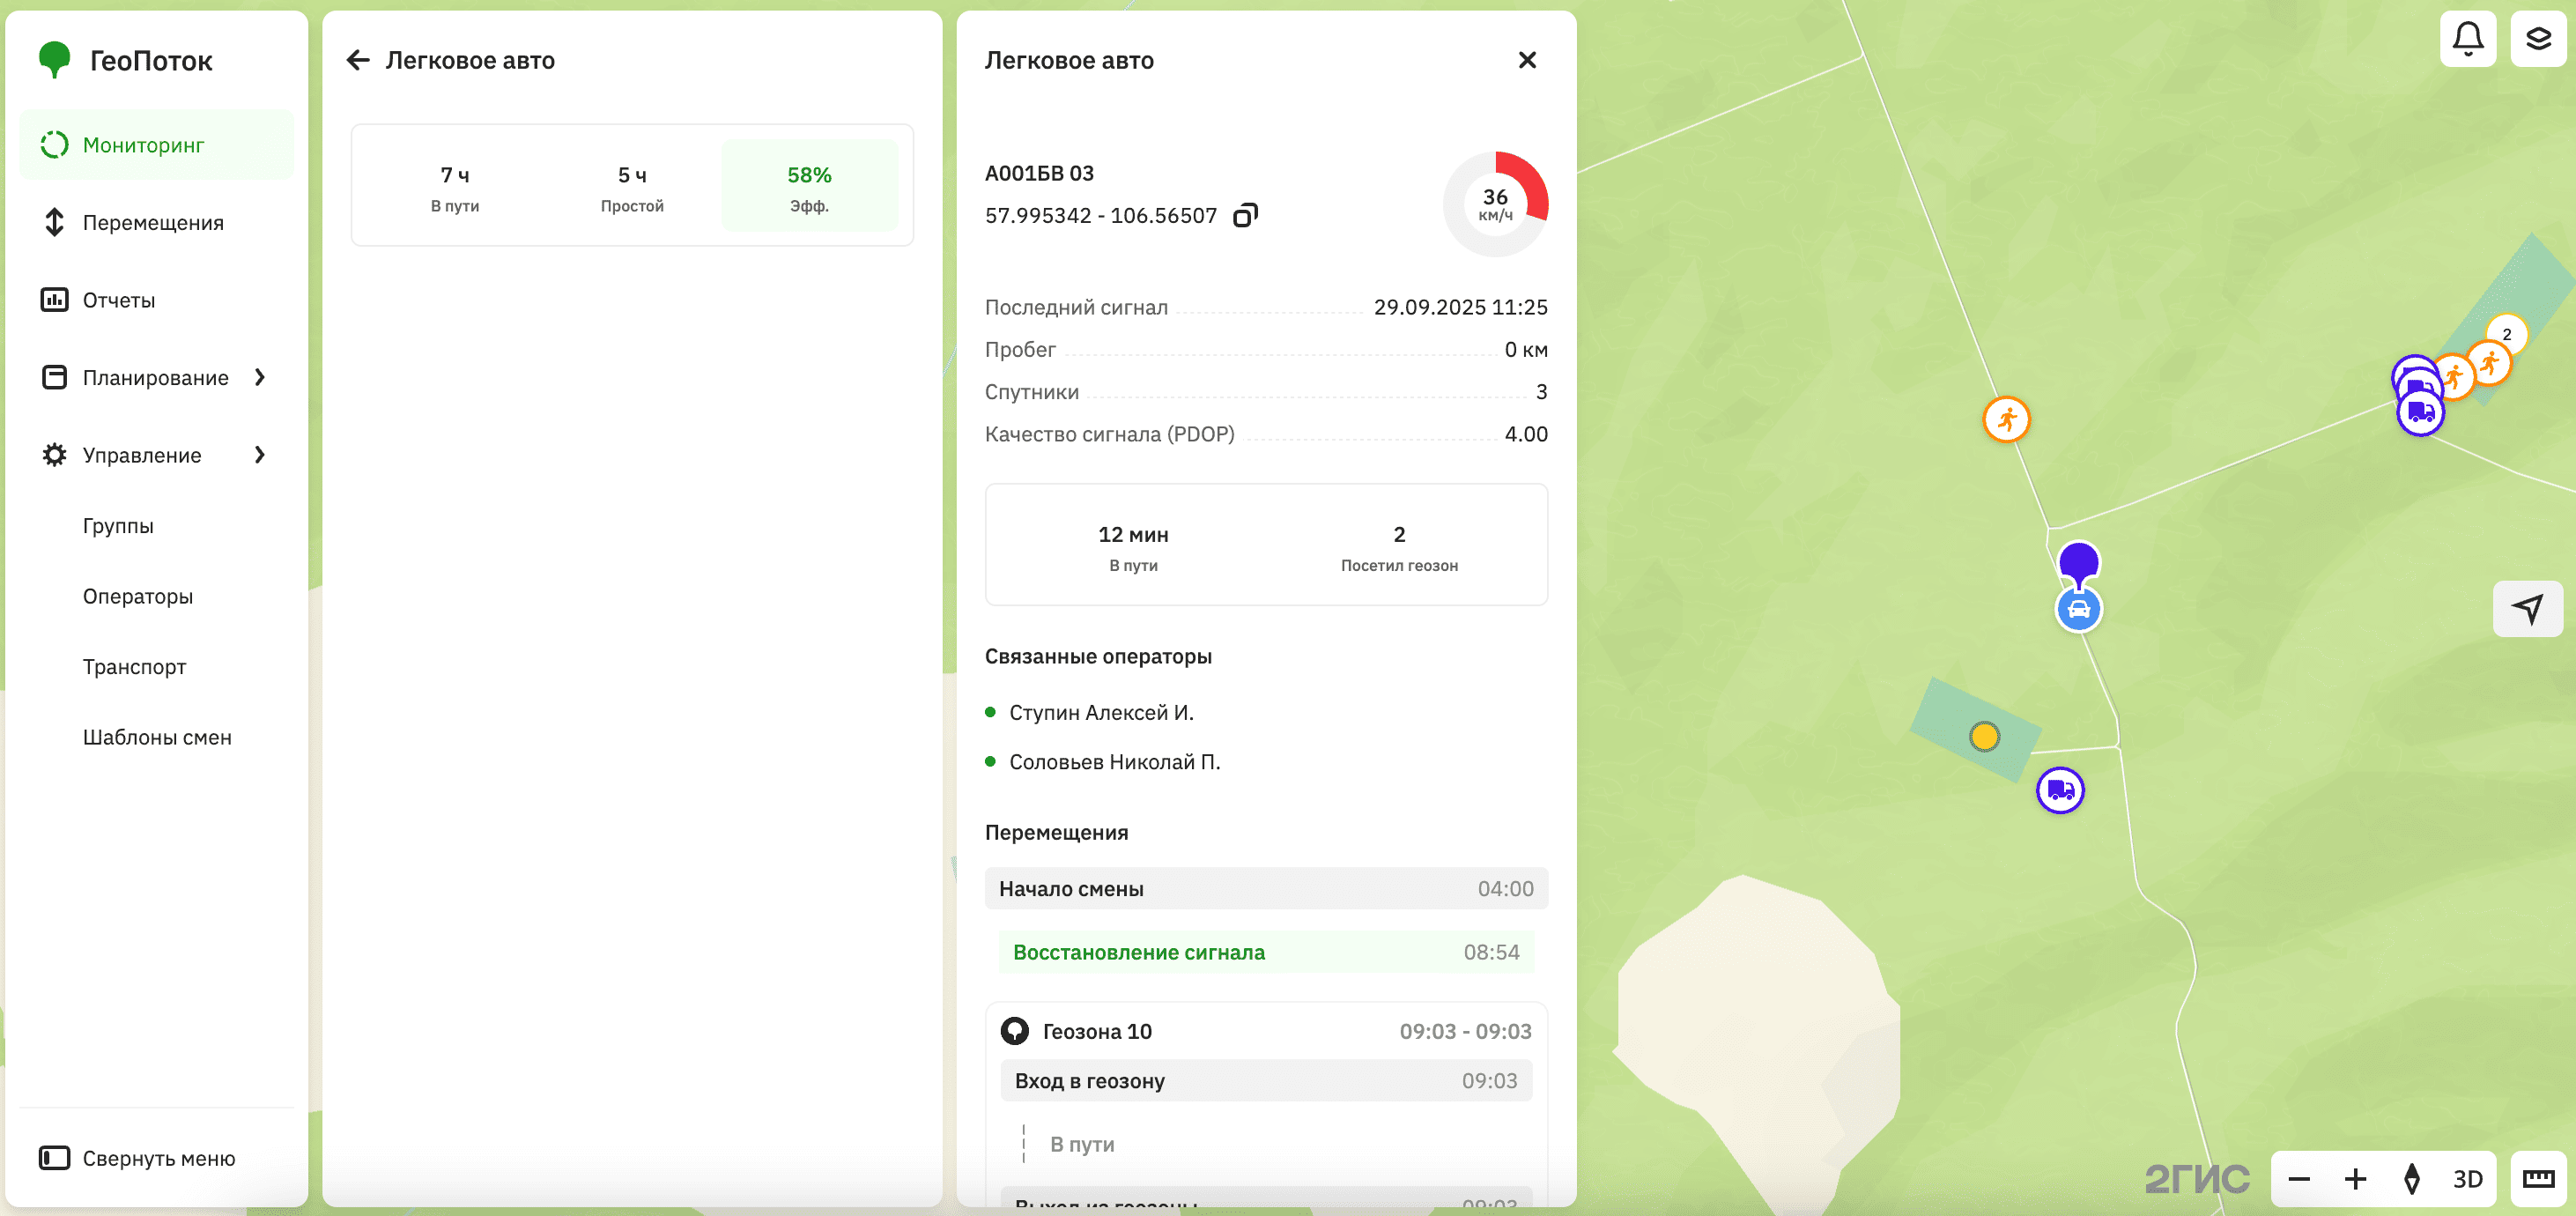
To view information about an object, click its icon on the map (the set of fields or their names may vary in your project):
-
Operators: the card displays the employee full name, section, group, qualification, work status, current geolocation coordinates, work statistics (time spent working, traveling, and on shift), tasks, assigned transport, and movement history during the shift.
-
Special equipment: the card displays the registration plate number of the vehicle, current geolocation coordinates, signal data, work statistics (time spent traveling and the number of geozones visited), assigned employees, and movement history during the shift.
-
Passenger cars: the card displays the registration plate number of the vehicle, current geolocation coordinates, signal data, work statistics (time spent traveling and the number of geozones visited), assigned employees, and movement history during the shift.
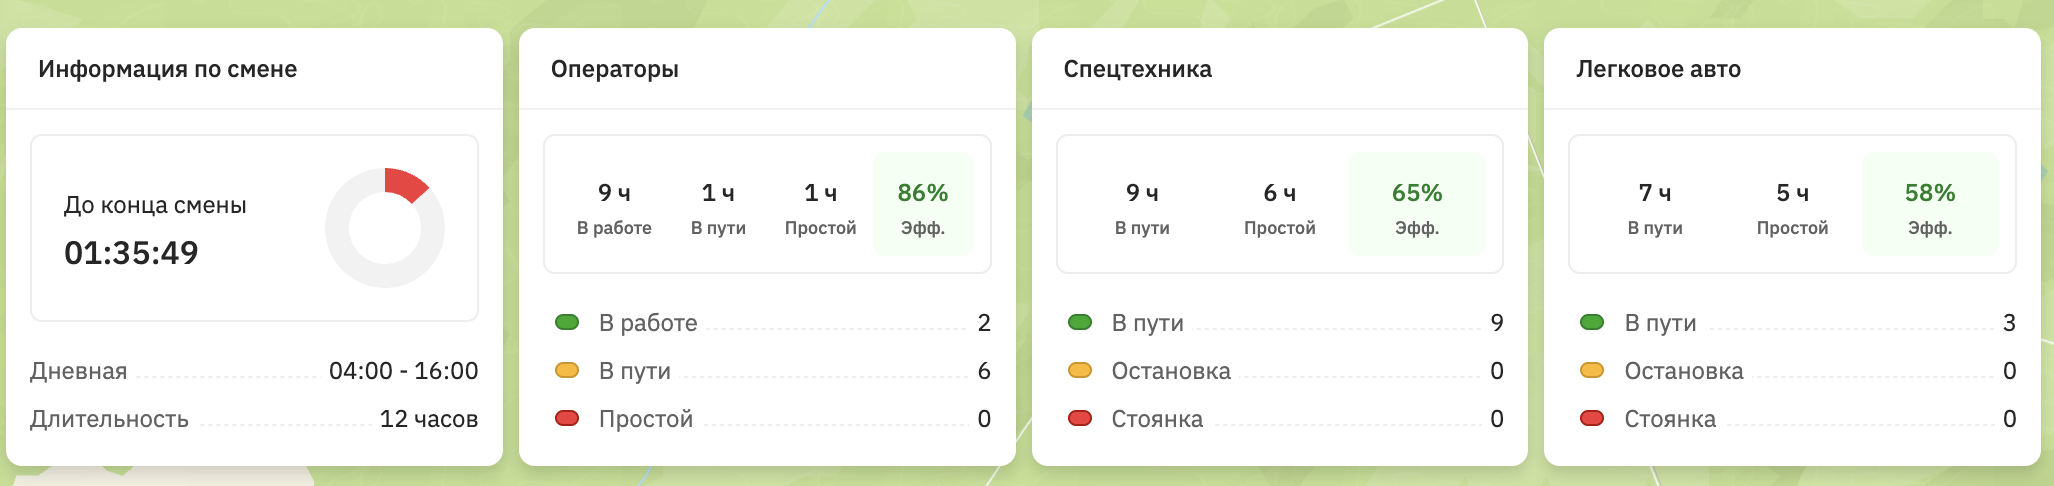
Analyzing shift statistics
When the shift is active, the monitoring dashboard displays the following widgets (the set of widgets or their names may vary in your project):
- Shift information: shows the remaining time until the end of the current shift, its name, hours, and duration.
- Operators: shows the number of employee work hours (planned, actual, and idle hours) and the percentage of work efficiency. It also displays the number of employees working, traveling, and waiting.
- Special equipment: shows the number of work hours for special equipment (planned, actual, and idle hours) and the percentage of work efficiency. It also displays the number of vehicles traveling, stopped, and parked.
- Passenger cars: shows the number of work hours for passenger cars (planned, actual, and idle hours) and the percentage of work efficiency. It also displays the number of cars traveling, stopped, and parked.
The statistics include information only about objects added to the shift.
To open the dashboard, go to the Monitoring tab. Examples of widgets: