Overview
The administrator can use the web panel, which includes the following tabs (the names of the tabs may vary in your project):
- Monitoring: to view general statistics of the current shift in real time.
- Movement: to view data on the movement of individual mobile employees and transport during past shifts.
- Reports: to view and download automated reports. Reports are generated based on the event model and system internal analytics.
- Planning: to plan shifts and assign employees and transport to them.
- Management: to manage data for monitoring objects (employees, employee groups, transport, etc.).
Important
This section provides screenshots with examples of the interface in Russian.
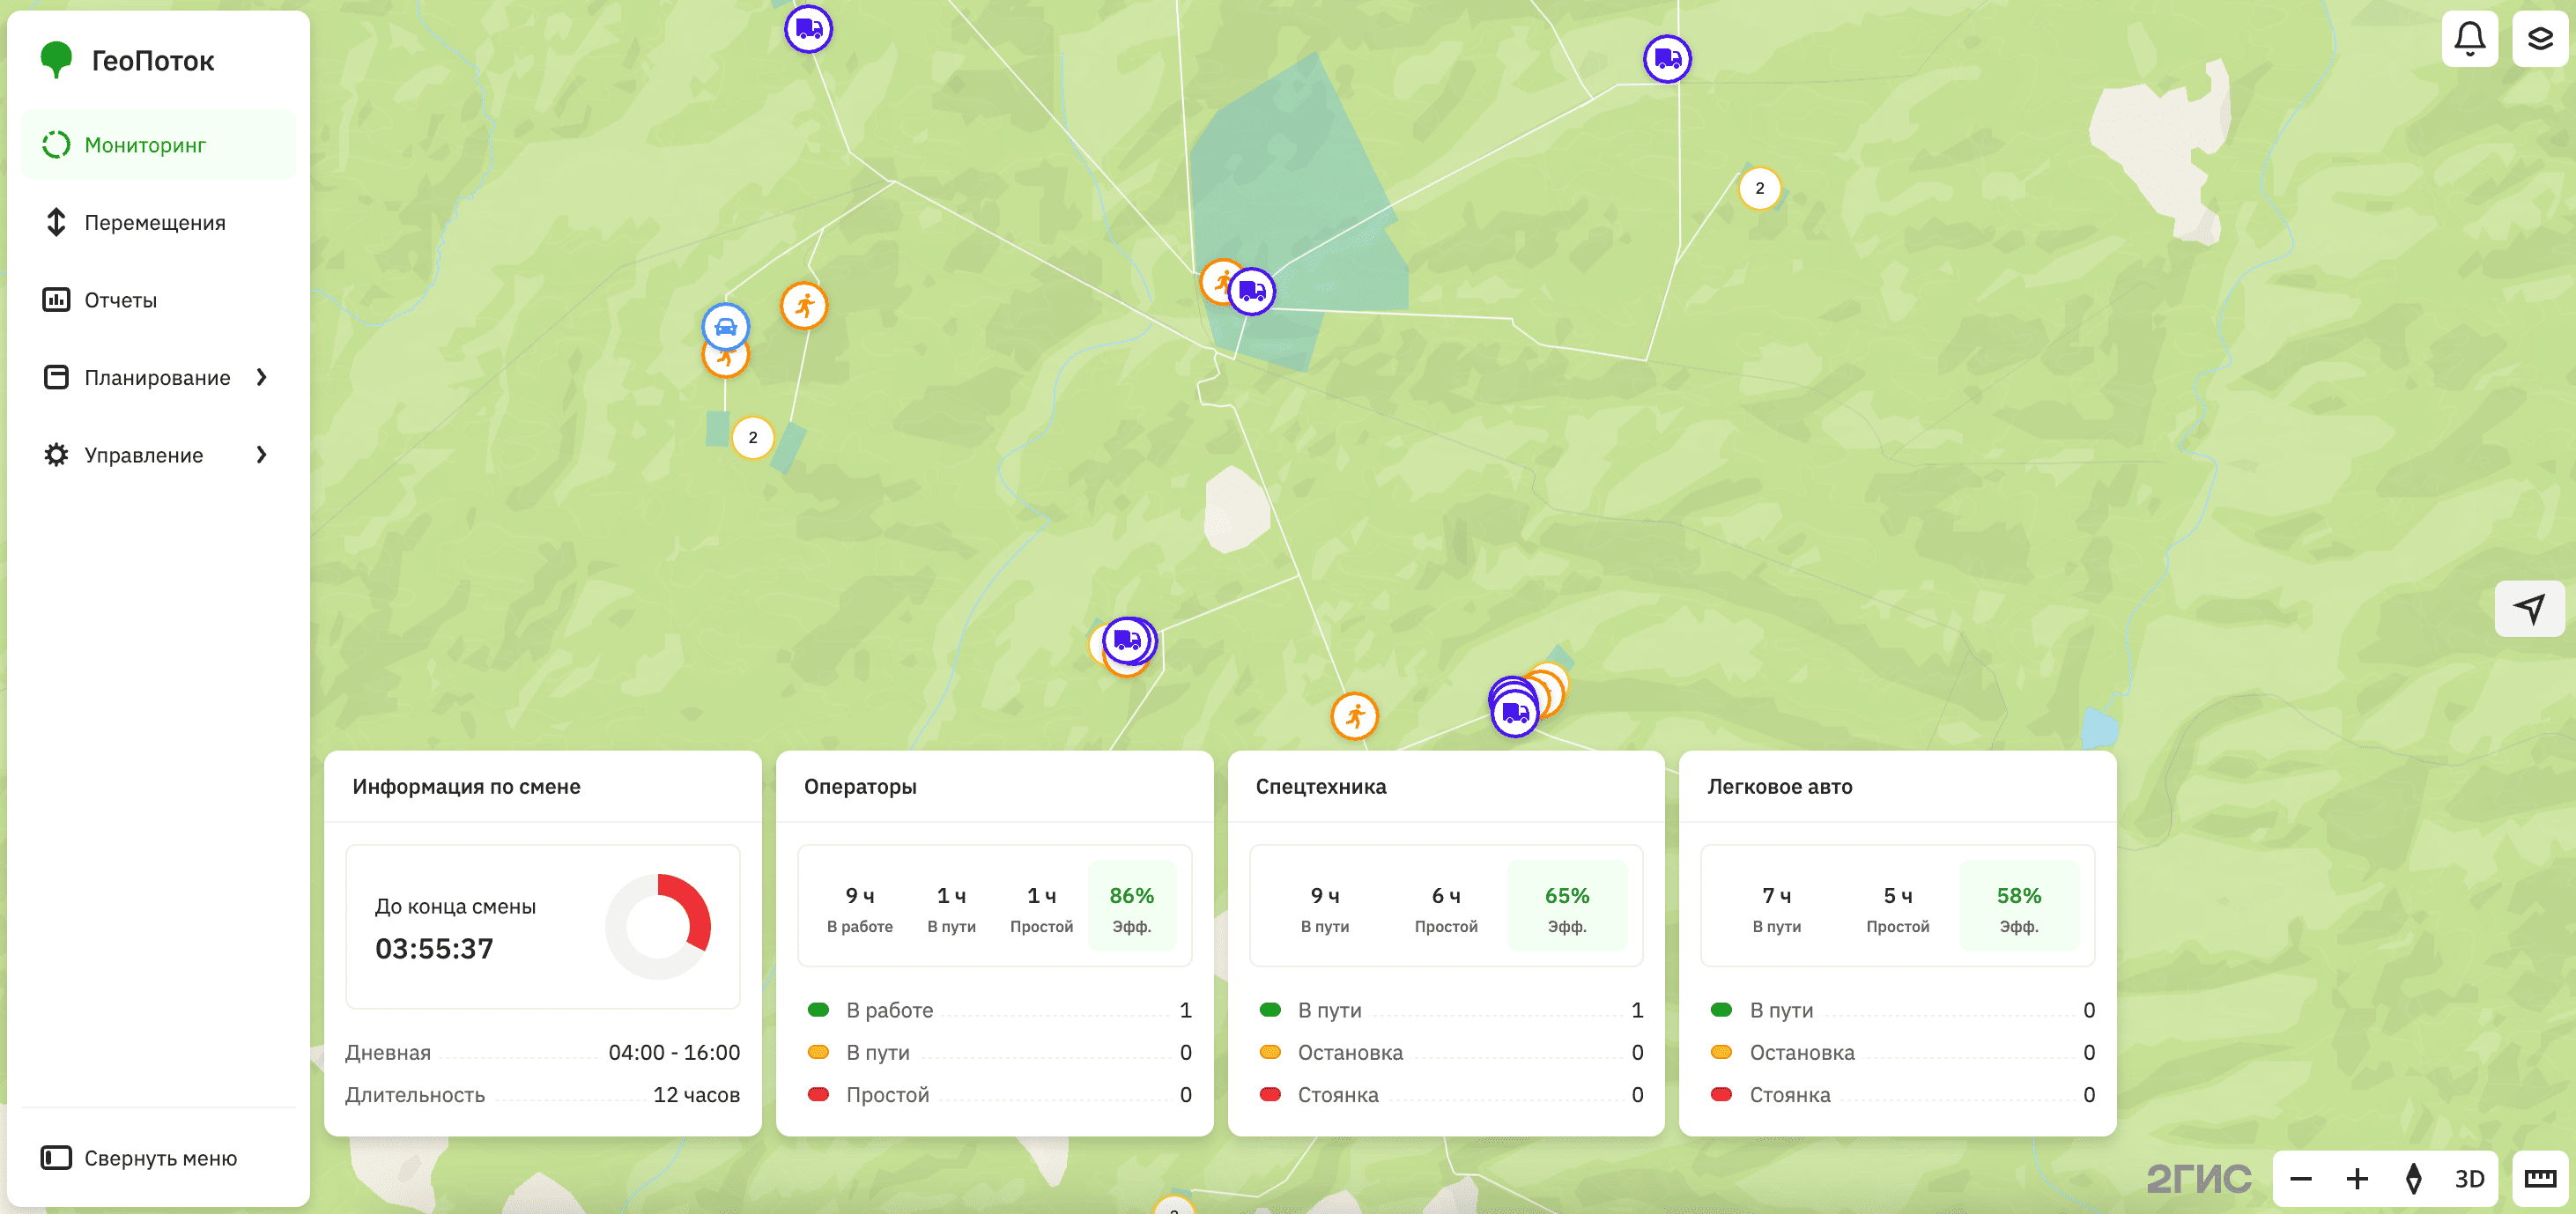
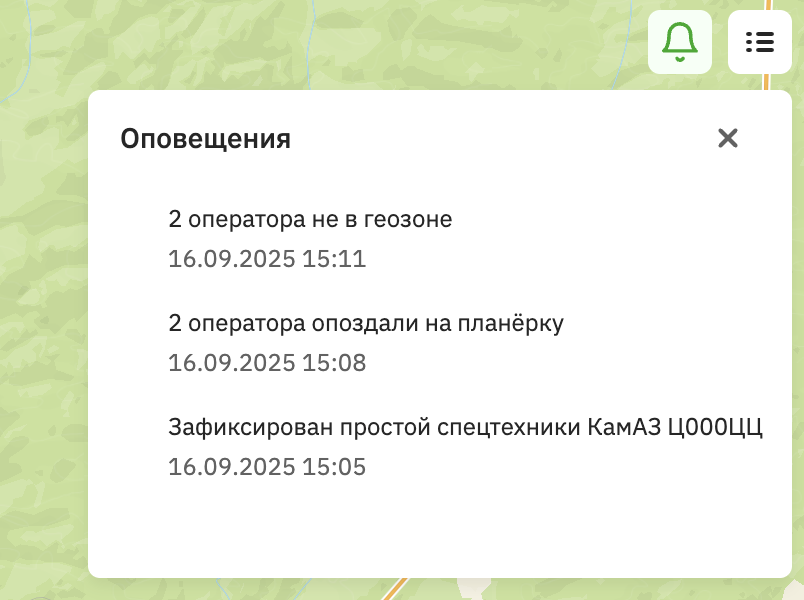
In all interface sections, the Alerts panel with notifications about events (e.g., an employee being late for a shift, transport downtime, etc.) is available:
Getting started
-
Complete the preparatory steps:
-
Make sure that the following data was uploaded during the 2GIS GeoFlow integration:
- Map areas with organization infrastructure: auxiliary geozones (with residential, administrative, utility, and other facilities) and production geozones (areas for performing work).
- Mobile employees (e.g., operators and others).
- Possible employee qualifications.
- Structural units of the organization where employee groups work (e.g., sections, teams, workshops, offices, etc.).
- Transport (e.g., passenger cars and special equipment).
If necessary, you can add new employees and transport or update existing objects data: see the Managing section.
-
Assign employees to groups. Employee groups must be linked to the sections created before.
-
Make sure that report templates were configured during the integration of the service.
-
-
Plan a shift. You can plan shifts daily or for several days in advance.
-
Monitor the movement of employees and transport in real time during shifts, analyze efficiency metrics, and also review movement history and download reports for past shifts: see the Monitoring section.